HypothesisIf a coded spreadsheet is used to determine allele frequencies, then it will be able to show the dependent and independent variables within the population. PredictionI predict that if I change the alleles, then the genotypes will change. Alleles make up a gene, so if I were to change an allele the genotype would be changed. Also, if you change the allele frequency, then the amount of the allele will either go up or down, which changes the amount of the allele. Once the amount of the allele has been changed, the genotype will also change. Procedures
Materials
Graph Comparison and Justification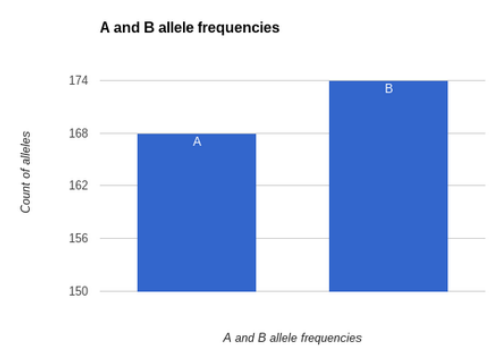 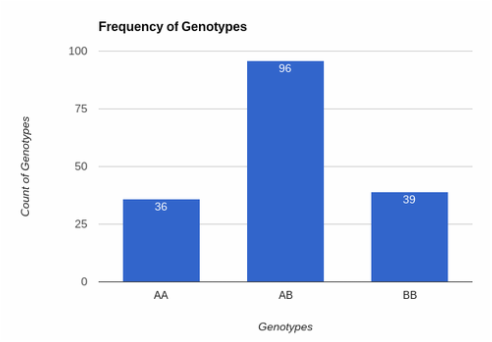 The first graph shows the amount of A and B alleles. A is p (the dominant allele) and B is q (the recessive allele). There is a higher amount of the recessive gene (174) then there is the dominant gene (168). The second graph is comparing the three genotypes. The homozygous dominant is the least common genotype, it only appeared 36 times out of 171.The second most common is the homozygous recessive (39). The majority of genes were heterozygous AB, there are 96 individuals that are heterozygous. The independent variable of these two graphs is the A and B alleles, and the size of our sample population. The p/q frequencies and the size of the population affect the genotypic outcomes. ConclusionThe independent variable in this investigation is the alleles (gametes). They affect the dependent variables, the genotypes (zygotes). Once the gametes change, the zygotes change. For example if my gametes are A and A, my zygote is AA. But if my gametes are A and B my zygote is AB. Since my B frequency was higher, my AB and BB were more popular among the population, rather than my AA.
2 Comments
9/23/2016 10:51:49 am
Love the font. Your blab is very organised. In your graph justification you said, "there was 96". 96 what? Please clarify. You could fix this by labeling the values. Also a key for your graphs could be helpful. 9/25/2016 09:04:06 pm
Hi Anna! Your inv. 2 is very visually pleasing and well-organized! However, I would suggest adding a conclusion to it. I advise checking the conclusion section of the rubric because Mrs. Blake has what she expects to be in the conclusion written there. Other than that, I really like it! Leave a Reply. |
AuthorAnna Gueorguieva is a sophomore at El Capitan High School. Dates |
 RSS Feed
