HypothesisIf PTC can only be tasted by people who have the dominant (p) allele then, the majority of the sample size will be able to taste PTC. PredictionI predict that the majority of the class will be able to taste the PTC. That is because being able to taste PTC is a dominant trait, so there is a greater chance of getting the PTC gene. Procedures
Materials
Date Table of P and Q alleles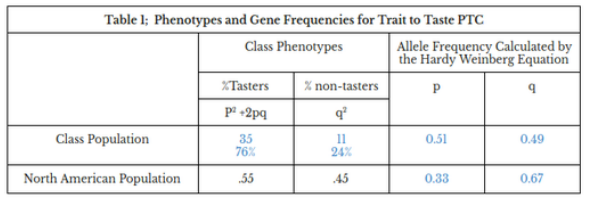 Study Questions
ConclusionThis experiment showed us that the frequency of an allele affects the percentage of people who have can taste PTC. PTC can only be tasted by individuals that have the dominant allele. We see that within our classroom because the frequency of the p allele is 0.51. So, the heterozygous and homozygous dominant genotypes will be more frequent than the homozygous recessive. We know that is true because 76% of the class could taste the PTC while 24% could not.
1 Comment
HypothesisIf a coded spreadsheet is used to determine allele frequencies, then it will be able to show the dependent and independent variables within the population. PredictionI predict that if I change the alleles, then the genotypes will change. Alleles make up a gene, so if I were to change an allele the genotype would be changed. Also, if you change the allele frequency, then the amount of the allele will either go up or down, which changes the amount of the allele. Once the amount of the allele has been changed, the genotype will also change. Procedures
Materials
Graph Comparison and Justification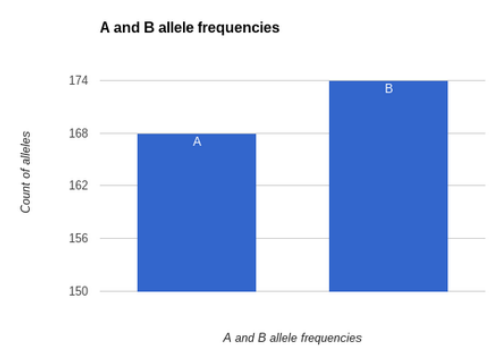 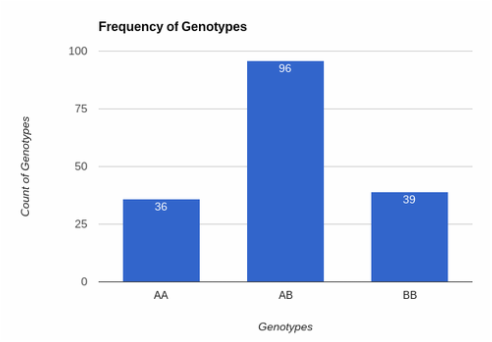 The first graph shows the amount of A and B alleles. A is p (the dominant allele) and B is q (the recessive allele). There is a higher amount of the recessive gene (174) then there is the dominant gene (168). The second graph is comparing the three genotypes. The homozygous dominant is the least common genotype, it only appeared 36 times out of 171.The second most common is the homozygous recessive (39). The majority of genes were heterozygous AB, there are 96 individuals that are heterozygous. The independent variable of these two graphs is the A and B alleles, and the size of our sample population. The p/q frequencies and the size of the population affect the genotypic outcomes. ConclusionThe independent variable in this investigation is the alleles (gametes). They affect the dependent variables, the genotypes (zygotes). Once the gametes change, the zygotes change. For example if my gametes are A and A, my zygote is AA. But if my gametes are A and B my zygote is AB. Since my B frequency was higher, my AB and BB were more popular among the population, rather than my AA.
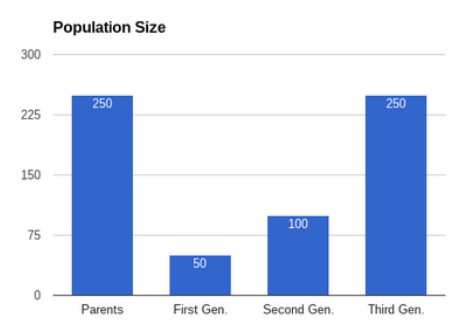
HypothesisIf there is a change in the size of a population, then there will be a change in the gene frequencies. PredictionIf I change the population size drastically, the allele frequency must change. This is because if there is a bottleneck effect that suddenly wipes out 3/4 of the q alleled individuals, the p allele frequency will go up, and vise versa. ProceduresWe want to show that the size of population effects the gene frequencies of the next generations.
Materials
Data Table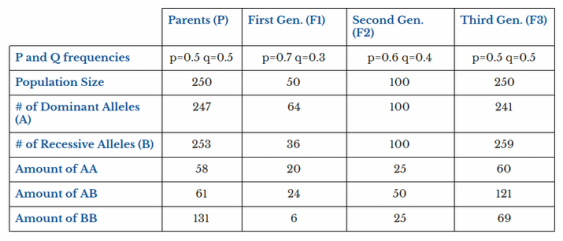 Graph and Justification
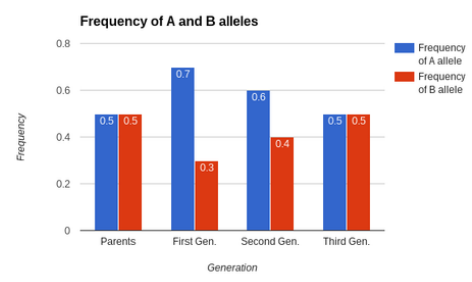 The graph above illustrates the allele frequencies within different generations. The offspring of the parent population experienced a bottleneck effect, and with that the allele frequency changes. We can assume that more individuals with the A allele survived. Then, in the second generation the A allele is 0.6 which is most likely due to selective pressure because there were more A alleled individuals. In the third population the allele frequency returns back to 0.5 for both alleles because the population has gone back to its average sized population.
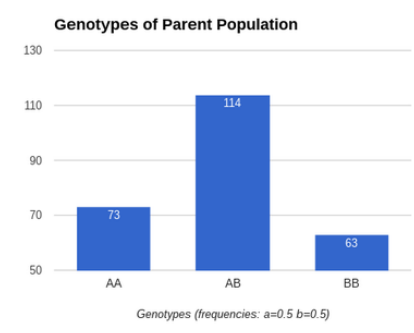
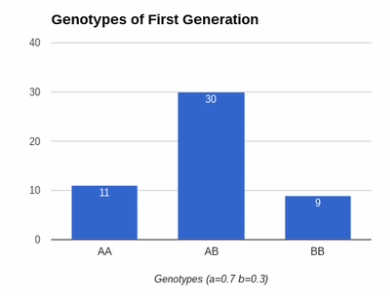 This graph shows the genotypes of the first generation. The frequency of the alleles are A=0.7 and B=0.3. However, the majority of the genotypes are AB which is different than I expected because of the high frequency of the A allele. 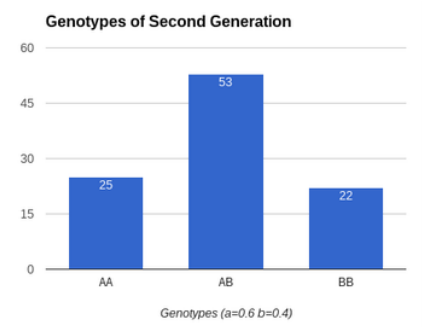 This graph shows the genotypes of the second generation. Here the allele frequencies are A=0.6 and B=0.4. The AB genotype is still the most frequent, however the AA is more than the BB and that was expected.  The final population, the third generation, is shown in this graph. The allele frequencies are back to A=0.5 and B=0.5 because the population has stabilized at 250 individuals. Once again, we see that AB is the majority and that AA and BB are equal, this makes sense because the allele frequencies allow for a 50/50 chance at all genotypes. Study Questions
ConclusionMy results showed that a change in population can result in a change in allele frequencies. My hypothesis was correct because I was able to prove how when a population decreases, the genotype frequencies changed We saw that in the first generation offspring of the parents. If this experiment were to be redone, a new formula could be written that instead of altering the population size, you alter the allele frequency and create a scenario. This scenario could be anything, maybe a bottleneck effect or a migration. The new hypothesis for that experiment would be; if the allele frequencies of a population change during an event, the population size and frequencies of genotypes would be altered. This is because we know that alleles alter your genotypes, and if alleles change, then the amount of each genotype will too. Some errors that occurred during this investigation were brought on by the spreadsheet. It took a lot of time to create charts that have properly labeling and information. Citations
|
AuthorAnna Gueorguieva is a sophomore at El Capitan High School. Dates |
 RSS Feed
