Title: Water Loss in Bush Bean LeavesHypothesisIf bush bean leaves are subject to different environmental conditions, then the rate at which the surface of the leaf loses water will be different depending on the condition. Procedures 1. Carefully place the non-tapered end of a 0.1 mL pipet into one end of a 16” piece of vinyl tubing. A small amount of petroleum jelly can be placed on the outside of the pipet at the non-tapered end to help insertion of the pipet. 2. Bend the tube into a U shape and secure onto a ring stand with clamp(s).The top of the tubing and the top of the pipet must be level in order to fi ll completely with water. 3. Fill the tubing and 0.1 mL pipet completely with water from the tubing end, using a 10 mL pipet. No air bubbles should be present in the tubing or 0.1 mL pipet. 4. Insert a freshly cut stem from a 2 week old bush bean seedling into the end of the tubing and seal with petroleum jelly. Do not get petroleum jelly onto the cut end of the stem or the experiment will not work! No bubbles should be present in the tubing or 0.1 mL pipet 5. Expose the stem to one of the following conditions assigned by your teacher: • Room conditions • 100 watt light source placed 1 meter from the stem • Fan 1 meter from stem on low to create a breeze • Mist of water from plant mister 6. After a 10 minute equilibration period, read the water level in the pipet and record below as time 0. You may want to use a marker to draw a line at the water level for each time point. (Hint: 12 mm = 0.01 mL) 7. Obtain a reading once every 5 minutes for 30 minutes on table 1 8. After 30 minutes, cut off the leaves of the bush bean seedling and blot off any excess water gently. Weigh the leaves. Weight of leaves __________grams. 9. Estimate the total leaf surface area for the plant. • Cut a 1 cm2 section out of a leaf • Mass the cut section = ________grams. • Multiply cut section mass by 10,000 to obtain the mass per square meter of the leaf = ________g/m2 • Using the formula below obtain the total leaf surface area (m2)): Total Weight of Leaves (grams) = Total Leaf Surface Area (m2 ) grams/m2 • Leaf Surface Area (m2) = ___________ 10. Using the formula below calculate water loss in mL/m2 at each reading (Table 1) by dividing the reading by the calculated leaf surface area: (water level at each T in mL) - (water level at Time 0 in mL) total leaf surface area in m2c Materials
Data TablesTABLE 1; Potometer Readings 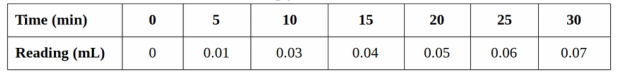 TABLE 2; Individual Water Loss in mL/m2 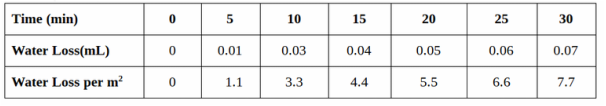 TABLE 3; Class Average Water Loss in mL/m2 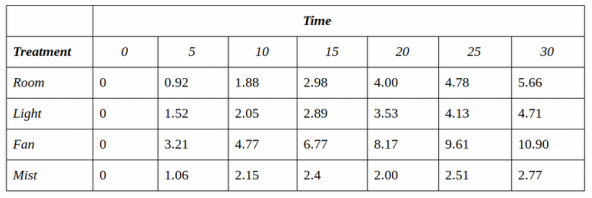 Graph1. Using class averages, graph the results from each treatment. 2. Label the independent variable (horizontal x-axis). 3. Label the dependent variable (vertical y-axis). 4. Title of Graph: Class Average Water Loss in mL/m2  Graph JustificationMy graph includes the averages, from the whole class, for all the different conditions.The independent variable within this graph is the time because it can be changed to affect the water loss. The different conditions are variables being tested. The amount of water lost is the dependent variable. The hypothesis being tested here is "If 4 different conditions are being tested on the leaves, then the fan will cause the most water loss". This hypothesis is correct because the fan did lose the most water. In 30 minutes, the plants that were subject to the fan lost the most water, (10.90 mL/m2). The plants that were not subject to any variable lost 5.66 mL per m2, and were very constistent in their growth. The mist was on track to lose more water, however near 10 minutes, it went down and gained a bit of water before losing water again for a total of 2.77 mL lost per m2. The plants subject to the light were in third for losing water, they lost 4.71 mL per m2. Analysis Question 5. What hypothesis is being tested in the experiment?
If bush bean leaves are subject to different environmental conditions, then the rate at which the surface of the leaf loses water will be different depending on the condition.
1 Comment
Title: Microscopic View of Bush Bean StemHypothesisIf a bush bean stem has been cut and processed, then its major structures will be able to be identified. Procedures 1. Obtain and assemble the nut and bolt microtome. Adjust the bolt so that there is a small cup at the end. 2. Cut a fresh slice of bush bean stem about 5-6 mm in length. It should be slightly longer than the cup you have formed in the microtome. 3. Place the cut stem into the microtome so that it stands up. Using a Pasteur pipet, fi ll the cup with melted parawax provided by your instructor. Work quickly as the parawax will cool and solidify in the pipet. 4. Wait 5-10 minutes for the parawax to completely solidify. When the wax has solidi- fi ed, lay the microtome on its side and with a new single-edged razor or scalpel blade, carefully slice away the excess wax. 5. Twist the bolt slightly to expose a thin piece of wax. Carefully slice off a thin section of wax/stem. With this simple apparatus, you are preparing thin cross sections of the bush bean stem. Using a spatula, place the sections in the petri plate containing 50% ethanol. Prepare 10 -12 sections. Allow the sections to soak for 5 minutes. 6. Transfer the sections to the Toluidine blue O stain solution contained in another petri plate. Stain for 5-10 minutes. 7. Transfer the stained sections to the petri plate containing distilled water. 8. Place the sections onto a microscope slide and cover with a cover slip. 9. Observe the sections under a compound light microscope. 10. Make drawings of the structures you observe. Try to see the plant stem cell types discussed below. Materials
Picture and Drawing of Stem 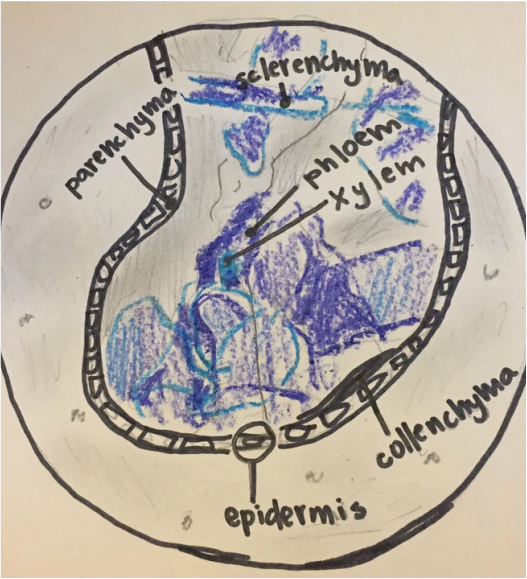 Analysis Questions 1. What was the total surface area of the plant The total surface area of the plant is 0.009125m^2 2. Determine the average amount of water loss per milliliter per square meter for each treatment:
Room temperature does not affect the rate of transpiration. However, if it is hotter then water loss will increase as long as there is water. Light increases water loss because light opens up the stomata and allows for water to evaporate. The fan increases the water loss because it puts more pressure on the leaf and increases water movement. Misting will decrease the rate of respiration because it created a humid environment. The humidity makes a more concentrated external environment which makes it harder for the stomata to take in and release water. 4. How did these conditions affect the stem to leaf water gradient? The stem to leaf water gradient is affected by water potential. Since the gradient is the movement of water up the stem and out the leaves. The room temperature does not affect the conditions much. The light can provide for more energy which increases the movement of water. The fan provides for pressure that can move the water up the stem and out the leaves. The mist creates a higher concentration outside the leaf and makes it harder for the plant to evaporate. 5. What is the importance of water potential in controlling the transport of water? Water potentional controls the movement of water. If a variable of pressure or solute is changed, water movement either increases or decreases. Pressure pushes water out onto the leaf where it can evaporate. If water potential is too high, then the water will not move. 6. Explain several mechanisms by which plants try to minimize water loss. There are different mechanisms in which plants minize water loss. One is that the stomata only opens during the night in order to prevent water from being evaporated quickly from the sun. Plants may evolve to contain smaller leaves in order to decrease surface area. Stomata underneath the leaf prevents excess evaporation. Thicker, waxy leaves can also store more water instead of releasing it. Leaf shape also affects it, thinner needle shaped leaves, such as lavander, prevents water loss. Conclusion In the first investigation of this lab, my hypothesis was supported by the evidence. My hypothesis for investigation 1 was "If bush bean leaves are subject to different environmental conditions, then the rate at which the surface of the leaf loses water will be different depending on the condition." This was true because the different environmental conditions; room, light, fan, and mist changed the rate at which the surface of the leaf loses water. The only thing not supported was the room temperature plants because they were not affected. Possible sources of error during investigation 1 were not reading the podometer correctly, calcuting averages and conversion incorrectly, and not keeping tracking in 5 minute intervals. If this experiment needed to be repeated, I think that it would be helpful to make a list of the formules and equations you need to preform. This is because it was a bit confusing having to go back and forth to convert measurements and averages.
In the second investigation of this lab, my hypothesis was not supported by my evidence. My hypothesis for investigation 2 was, "If a bush bean stem has been processed and cut, then the inside will be able to identify 6 major structures within plants." This was not supported thouroughly because even after the stem was cut and processed, it was very hard to find the 6 major structures. This was because the refrence picture of my stem was most likely not zoomed in enough. I got the basic shape of the stem, however I was not close enough to see cell shape or clearly identified structures. This was a source of error becuase it was hard to identify the structures with an unclear refrence. Another source of error that was possible was not processing the stem correctly, such as putting it in the wrong solution or not cutting off enough stem. I think that a change that could be made if this lab had to be repeated is that the holding of the stem while it is being cut is easier. It was very confusing on how exactly to hold the stem and the wax. This lab was very fun and informative because we were able to see the water leaving the leaves as the water levels dropped within the pipet. |
AuthorAnna Gueorguieva is a Sophomore at El Capitan High School. Dates |
 RSS Feed
